
Lead generation fraud is the silent killer of affiliate network profitability. While you're focused on scaling volume and recruiting new affiliates, sophisticated bad actors are submitting fake forms, gaming conversion tracking, and degrading the quality metrics that determine whether advertisers renew their contracts.
The worst part? Most networks only notice when it's too late — when advertisers start complaining about lead quality, suspending campaigns, or demanding refunds for worthless leads.
This guide covers the 8 most effective fraud detection signals that affiliate networks use to catch bad traffic before it destroys advertiser relationships, plus operational monitoring tactics that help you stay ahead of quality issues.
Part 1: Why Lead Generation Fraud Is Different (And Harder to Catch)
The Conversion Lag Problem
Unlike e-commerce affiliate marketing, where fraudulent transactions are usually detected within hours or days, lead generation fraud can take weeks to surface. Here's why:
- Initial conversion tracking looks normal: A bot can fill out a form perfectly, generate a "successful" conversion in your tracking platform, and trigger payout to the affiliate
- Real validation happens downstream: The advertiser only discovers the lead is worthless when they try to contact the prospect, verify information, or see if the lead converts to a paying customer
- Reporting delays: Many advertisers don't report lead quality issues immediately — they batch their feedback weekly or monthly
By the time you know you have a problem, you might have already paid out thousands in fraudulent commissions and damaged your relationship with the advertiser.
The "Gray Area" Challenge
E-commerce fraud is usually binary: either someone completed a legitimate purchase or they didn't. Lead generation fraud exists on a spectrum:
- Completely fake leads: Bots submitting random data
- Incentivized leads: Real people submitting genuine information but with no actual intent to engage with the advertiser (because they were paid or "forced" to fill out the form)
- Low-quality leads: Real prospects, but mismatched for the offer (wrong location, income level, etc.)
- "Shaved" leads: Legitimate leads that the advertiser claims are invalid to avoid paying commissions
Your fraud detection system needs to distinguish between these scenarios, which requires more nuanced analysis than simple bot detection.
The Two Business Models — and Why Fraud Hits Differently in Each
| Model | How It Works | Main Fraud Risk |
|---|---|---|
| CPL (Cost Per Lead) | Network pays affiliates per lead; advertiser pays network per lead | Fake/bot leads inflate volume. Advertisers may not shave, but they will complain about quality, renegotiate rates, or churn. |
| CPA (Cost Per Acquisition) | Network pays affiliates per lead; advertiser pays network per downstream action (FTD, sale, approved app) | Both affiliate-side fraud and advertiser-side shaving risk increase when downstream attribution is weak. |
Part 2: The 8 Fraud Detection Signals That Actually Work
1. Click-to-Conversion Time
How long between the affiliate click and the form submission? Sub-second or single-digit-second conversions are almost certainly bots.
2. Conversion Velocity
How many conversions per minute/hour from one affiliate? Rapid-fire submissions with less than 3 minutes between them deserve scrutiny.
3. Device Distribution Skew
An affiliate whose traffic is 95%+ iOS when the offer average is 55/45 iOS/Android. Extreme device skew indicates non-organic, manipulated traffic.
4. IP & ISP Analysis
Leads originating from datacenter IPs, known proxy/VPN ranges, or hosting providers. Real consumers don't fill insurance forms from AWS.
5. Conversion Rate Outliers
Affiliates with conversion rates 3–4x the offer average. Unusually high CR often means the affiliate is pre-qualifying or fabricating conversions.
6. Duplicate / Near-Duplicate Payloads
Identical sub-parameter patterns, same user-agent strings, or repetitive form data across conversions from the same affiliate.
7. Downstream Conversion Drop
Lead → FTD (or lead → sale) rates that decline as volume increases. The single most important signal for advertiser-side shaving or genuine quality degradation.
8. Form Time-on-Page (Delta)
Time the consumer actually spends on the form. If available, this is gold: a 15-field financial application completed in 8 seconds is not human.
Signal 1: Click-to-Conversion Time Analysis
What to track: The time between when a user clicks on an affiliate's tracking link and when they submit a conversion.
Why it matters: Bots or automated systems typically complete forms much faster than humans. A 12-field insurance lead form completed in 8 seconds is almost certainly not a real prospect.
How to implement:
- Track the delta between click timestamp and conversion timestamp
- Calculate percentiles per affiliate (P10, P25, P50, P90, P99)
- Flag affiliates where >20% of conversions happen in under 30 seconds for complex forms, or under 10 seconds for simple forms
- Set different thresholds based on form complexity and offer type
Red flags:
- Consistent sub-10-second conversions on multi-step forms
- Affiliates with conversion times that are statistical outliers compared to the network average
- Step changes in conversion speed (sudden shift from human-like times to bot-like times)
Signal 2: Conversion Velocity and Timing Patterns
What to track: How many conversions an affiliate submits per minute/hour, and the temporal distribution of those conversions.
The pattern: Real human traffic has natural variation in timing. Bot traffic often shows machine-like regularity.
Implementation:
For each affiliate per hour:
- Track conversions per minute
- Flag if ≥3 conversions in same minute repeatedly
- Flag if conversions are evenly spaced (every 30 seconds for an hour)
- Monitor for burst patterns (100 conversions in 10 minutes, then silence)
Refinements:
- Time zone normalization: A US affiliate getting conversions at 3 AM local time deserves extra scrutiny
- Traffic source consideration: Search traffic naturally peaks during business hours, while social media traffic has different patterns
Signal 3: Device and Browser Distribution Anomalies
The principle: Real affiliate traffic should show natural diversity in devices, browsers, and screen resolutions. Bot traffic often shows suspicious uniformity.
What to flag:
- An affiliate whose traffic is >90% from the exact same browser version and screen resolution
- Massive desktop/mobile skew that doesn't match the traffic source (e.g., 95% mobile for search campaigns)
- Unusual operating system distributions (like >50% outdated Windows versions)
- Missing or unusual User-Agent strings
Important caveat: Most tracking platforms (including Everflow) don't reliably capture the affiliate's traffic source. Even if there's a "source" parameter in tracking links, affiliates frequently leave it blank. So you can't easily filter by "Facebook traffic only." What you can do is flag device distribution anomalies at the affiliate level regardless of declared source, and let your AM team investigate further.
Signal 4: IP and ISP Analysis
This is one of the most powerful fraud signals but requires an external lookup step. For every conversion (and ideally every click), you can resolve the IP address to:
- ISP / ASN: Determine if traffic comes from residential ISPs (more likely legitimate) or datacenter/cloud providers like AWS, Google Cloud, DigitalOcean, OVH (much higher probability of bots)
- IP risk score: Services like IP2Location, MaxMind, or IPQualityScore maintain databases of IPs associated with known botnets, open proxies, VPNs, and previously flagged fraud activity
- Geo consistency: Does the IP geo match the offer's target geography? A US insurance lead originating from a Romanian IP is immediately suspect
💡 Pro tip: You don't need to score every single IP in real time. A batch process that runs daily or weekly, resolving and scoring the IPs from your conversion logs, is enough to surface the biggest issues. Start with the affiliates driving the most volume and work your way down.
Signal 5: Conversion Rate Outliers
An affiliate with a 40% conversion rate on an offer where the network average is 8% deserves immediate attention. There are legitimate reasons for high CRs (highly targeted email lists, premium placements), but extreme outliers — especially new affiliates — should be flagged automatically.
Key refinement: Don't compare against the global network average. Compare against affiliates running the same offer in the same vertical. A finance offer in the US might have a naturally different CR baseline than a nutra offer in Germany.
Signal 6: Duplicate and Near-Duplicate Payloads
Look at the sub-parameters, user-agent strings, and any other metadata attached to conversions. If you see:
- Identical sub1/sub2/sub3 values across dozens of conversions
- The exact same user-agent string on every conversion from one affiliate
- Conversions from the same IP within the same session but with different "unique" identifiers
...then you're likely looking at automated submissions that aren't properly randomizing their fingerprints.
Signal 7: Downstream Conversion Drop (The Shaving Signal)
This is arguably the most important signal for networks operating on CPA models, and it's the one that's hardest to detect because it requires looking at data you don't fully control — the advertiser's reported downstream events.
The scenario: You're sending leads (signups) to a casino operator. They pay you CPA on first-time deposits (FTDs). Your tracking shows signups are growing nicely. But the advertiser's reported FTD count isn't growing proportionally. Your signup → FTD rate used to be 12%, now it's dropped to 5%.
Two possible explanations:
- Genuine quality degradation: Your affiliates are scaling with lower-quality traffic sources, and fewer signups are converting to depositors. This is a real problem that needs attention — but it's an optimization challenge, not fraud.
- Advertiser shaving: The advertiser is underreporting FTDs to reduce their payout to you. This is fraud committed against the network.
How to distinguish between the two:
- Track the signup → FTD rate as a time series per affiliate. If the drop is uniform across all affiliates (including your highest-quality, most established partners), shaving is more likely. If it's concentrated in specific affiliates who recently scaled, it's more likely a quality issue.
- Look for step changes: a sudden drop from one day to the next with no corresponding change in traffic mix or volume is suspicious.
- Cross-reference with other advertisers in the same vertical. If your iGaming conversion rates are stable with Advertiser A but suddenly dropped with Advertiser B, the problem is likely on Advertiser B's end.
🚨 The CPL vs CPA distinction matters here: In a CPL model, the advertiser has less incentive to lie about quality dropping — they're paying per lead regardless. If they complain about quality, it's almost certainly genuine. But in a CPA model, shaving becomes financially attractive because every unreported FTD is money saved. This is where time-series anomaly detection becomes essential.
Signal 8: Form Time-on-Page (Delta Parameter)
The "delta" — time the user actually spends filling out the form — is the single best indicator of whether a human is on the other side. A 15-field financial services application completed in 4 seconds is a bot. Period.
The challenge: This data usually lives in the advertiser's landing page analytics (Google Analytics, custom JavaScript events), not in your tracking platform. Most tracking platforms don't receive this information natively.
Workarounds:
- If you control the landing page: Add a JavaScript timer that captures form start → form submit duration and passes it back to the tracking platform as a sub-parameter or postback value
- If you don't control the landing page: Use the click-to-conversion time as a proxy (Signal 1), and flag same-second conversions as likely automated (if two conversions from the same affiliate post at the exact same second, at least one was not a real human interaction)
- Ask the advertiser: Some advertisers will share aggregated form-completion time data per affiliate if you explain it's for quality assurance
Part 3: Beyond Fraud — Operational Monitoring That Protects Lead Quality
Fraud detection is reactive by nature — you're catching bad traffic after it happens. But there are proactive monitoring systems that help you stay ahead of quality issues before advertisers start complaining.
Monitor Signup → FTD (or Lead → Sale) Conversion Rates Continuously
Don't wait for the advertiser to tell you quality dropped. If you have visibility into downstream events (and many tracking platforms support multi-event tracking), build a time-series dashboard that shows the lead-to-qualified-action conversion rate per affiliate, per offer, per day.
Set alerts for:
- Any affiliate whose downstream rate drops below 50% of their 30-day rolling average
- Any offer where the overall downstream rate drops more than 20% week-over-week
- Any new affiliate whose downstream rate is significantly below the offer average after their first 50 conversions
Track Whether Affiliates Actually Start Running Approved Offers
This is a common blind spot in network operations: an AM approves an affiliate on 10 offers, but the affiliate only starts sending traffic on 2 of them — or none at all. Without monitoring, nobody notices for weeks.
Build a simple report that tracks:
- Offer approved date → First conversion date (activation lag)
- Affiliates with approved offers but zero conversions after X days
- Affiliates who were active on an offer but suddenly stopped (which could indicate they found issues with the offer, or moved to a competitor)
Monitor Creative Age and Performance Correlation
In lead generation, creative fatigue happens faster than in other verticals. A banner that generated high-quality leads in Month 1 might be attracting bottom-funnel traffic by Month 3.
Track correlation between:
- Creative age (time since first use) and lead quality metrics
- Creative age and conversion rates
- Creative age and downstream performance (FTD rates, etc.)
If you see quality degrading as creatives age, that's a signal to refresh creative assets more aggressively.
Part 4: Building Your Fraud Detection Stack
Option 1: In-House Development
If you have a data team, you can build monitoring directly in your data warehouse:
Required components:
- ETL pipeline pulling data from your tracking platform's API
- IP geolocation and risk scoring service integration
- Time-series database for storing conversion events
- Alerting system for anomaly detection
- Dashboard for investigating flagged affiliates
Rough timeline: 2-3 months for a basic version, 6+ months for a sophisticated system
If you need help building or updating such a system in house, please do not hesitate to check out Witanalytica's affiliate marketing data analytics managed services, starting at 80 EUR per hour or offering per-project pricing:
Option 2: Platform-Based Solutions
Some tracking platforms offer built-in fraud detection, but coverage is often limited to basic bot detection.
Platforms with fraud features:
- Cake (LinkTrust): Basic bot detection and click flooding protection
- Everflow: Device fingerprinting and some anomaly detection
- PartnerStack: Focused on SaaS, so fraud features are more partner-behavior focused
Limitations: Most are rule-based rather than ML-driven, and don't include sophisticated time-series analysis
Option 3: Specialized Anti-Fraud Services
Companies like FraudScore, ClickGUARD, and Anura offer dedicated click fraud detection APIs that you can integrate with any tracking platform.
Pros: Deep expertise in fraud detection, continuous updates to detection algorithms Cons: Additional cost, integration complexity, may not cover all the lead-gen specific signals we discussed
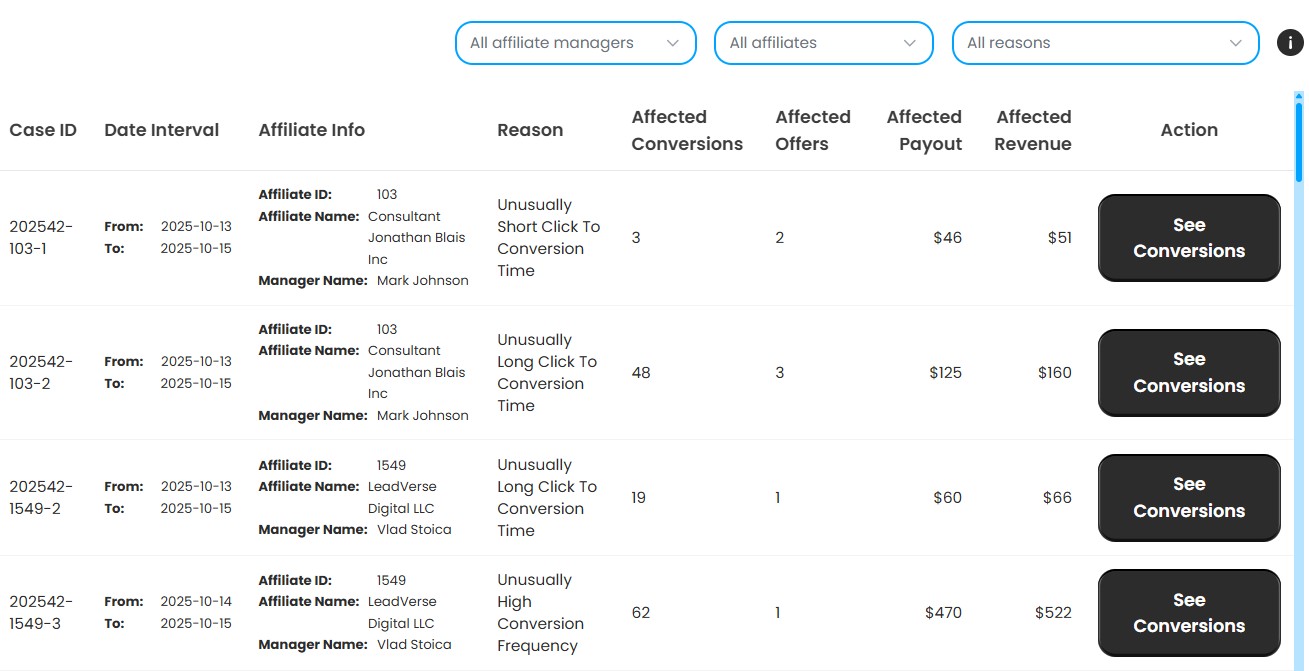
Option 4: CatStats
CatStats includes basic but smart fraud detection patterns built on benchmarking the same offer across multiple affiliates. Instead of looking at one affiliate in isolation, it compares each affiliate's behavior against the offer baseline to surface statistically unusual conversion behavior early.
- Unusually short time — Conversions happening within seconds of the click (often bots, or cookie stuffing)
- Unusually long time — Conversions firing several hours or even days after the click (possible delayed postbacks or fake fires)
- Unexpected device distributions — Affiliates with a high percentage of conversions coming from devices that are not typical for that offer are flagged (e.g. an affiliate having 87% Apple conversions on an offer that typically generates Desktop PC conversions — this is a common fraud pattern)
- High frequency per minute — Groups of more than 30 conversions happening within a minute are flagged for review (often indicative of bot activity)
Final Checklist: Is Your Leadgen Network Protected?
- You monitor click-to-conversion time per affiliate and flag sub-threshold latencies
- You track conversion velocity and flag rapid-fire submissions
- You analyze device distribution per affiliate and flag extreme skew
- You resolve conversion IPs to ISP/ASN and flag datacenter traffic
- You track downstream conversion rates (lead → FTD / sale) as a time series
- You have alerts for sudden downstream rate drops (shaving detection)
- You compare conversion rates per affiliate against the offer/vertical baseline, not the global average
- You monitor whether approved affiliates actually start sending traffic
- You track creative age and correlate it with performance decline
- Your AM team receives a weekly fraud summary with actionable recommendations
If you checked fewer than 5 of these, there is significant room to improve your fraud prevention and lead quality monitoring. The good news is that most of these signals are already sitting in your tracking platform data — they just need to be extracted, analyzed, and surfaced in a way that your team can act on.
The networks that win in leadgen are not necessarily the ones with the most affiliates or the most offers. They're the ones that can guarantee quality to their advertisers — and prove it with data.